Target Audience Research - Pie Charts
Through doing research into our target audience, we interviewed a variety of 40 different people using a questionnaire that we created. As a group we then decided to display our data on pie charts. This is because we felt that they are effective in showing a contrast in our answers that the target audience selected. This is our groups pie charts:
 When creating our questionnaire, we made sure that we considered both male and females so therefore our findings are no way gender bias. This in turn means that our findings can be generalised to the wider population. Our finding display a true representation by considering both genders within our questionnaire results and therefore they are likely to be more accurate.
 When completing our questionnaire we considered a wider range of different aged audience ranging from the age of 14- 26+. This therefore makes our finding reliable as they can be applied to a wider ranged audience. The majority of the people we gave the questionnaire to was people aged 17-19. This is because these people were readily available as they were at school.
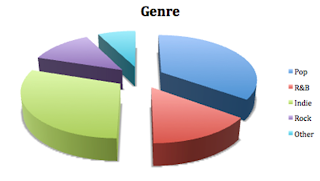 We decided to research the most popular genre of music as we would consider using a artist of the genre. This would be because we want to make our music video as successful as we can, therefore there would be a larger target audience that would watch our video. Luckily, the most liked music genre was identified as pop which coincides with our artist James Arthur. Therefore we decided to stick to our chosen music artist.
 As shown in the pie chart, the most amount of music videos watched on average per week is estimated around 11-15.
 When creating the questionnaire, we asked what was the preferred music video aspect: performance, narrative or concept based. This is vital information that we wanted to find as it would influence the style of the music video that we would create. As shown in the pie chart, performance and narrative are the more popular aspects of the music video and therefore we decided to used these element. This is also a convention of the pop music genre therefore our style of music video would be conventional. As a group we decided that 70% of our video will consist of a narrative based and 30% will be performance based.
 When creating our questionnaire, we made sure that we considered both male and females so therefore our findings are no way gender bias. This in turn means that our findings can be generalised to the wider population. Our finding display a true representation by considering both genders within our questionnaire results and therefore they are likely to be more accurate.
 We decided to research the most popular genre of music as we would consider using a artist of the genre. This would be because we want to make our music video as successful as we can, therefore there would be a larger target audience that would watch our video. Luckily, the most liked music genre was identified as pop which coincides with our artist James Arthur. Therefore we decided to stick to our chosen music artist.
 As shown in the pie chart, the most amount of music videos watched on average per week is estimated around 11-15.
 When creating the questionnaire, we asked what was the preferred music video aspect: performance, narrative or concept based. This is vital information that we wanted to find as it would influence the style of the music video that we would create. As shown in the pie chart, performance and narrative are the more popular aspects of the music video and therefore we decided to used these element. This is also a convention of the pop music genre therefore our style of music video would be conventional. As a group we decided that 70% of our video will consist of a narrative based and 30% will be performance based.
 One question we asked was what music video would you prefer to watch, a diverse or conventional one. The pie chart shows that a conventional music video is more popular as the audience are able to relate to the narrative more than a diverse music video, therefore in our music video we are going to conform to stereotypical pop conventions.
 The majority of the people we interviewed said that they have heard of our chosen artist. This is useful as it confirms that our artist is well known, and therefore the music video is likely to appeal to a large majority of people.
 The pie chart suggests that the preferred editing style is slow paced. This is because it creates a easy going music video that has a continuous flow. Therefore this will be considered when it comes to editing our music video.
 Those who stated that they knew the artist, we then asked what was their favourite single. The majority of the people said their favourite was 'impossible' as it was his most established song. Therefore as a group we are confident that this is the more appropriate song choice as it would appeal to a large audience.
This researched has helped me when it comes to planning our music video as it has given me a better understanding of what the audience expects to see in a music video. I am going to consider the finding when creating our music video by conforming to the pop conventions, and using slow pace editing. We have also decided to use 70% narrative and 30% performance which is something that the audience preferred to see.
The pie charts that you have included, demonstrates the results that you received from your questionnaires.
ReplyDeleteNow you need to explain how your research will assist you with planning your own music video